Warning! Do not try building bitdrift at home
Like many vendors, especially in the developer tools / infrastructure space, we sometimes face a “build versus buy” conundrum from prospective customers. It’s always a difficult decision that organizations have to make during purchasing decisions; how to weigh the known spend outlay for a vendor versus the opportunity cost of building a similar solution in-house (and then having to maintain it).
To recap, bitdrift takes a novel approach to observability: we couple local telemetry storage along with real-time control, allowing users to ingest zero data by default, and get 1000x the data when they actually need it to solve customer problems. The rest of this post assumes a general familiarity with the product. For more background see bitdrift.io, blog.bitdrift.io, and docs.bitdrift.io.
In some ways, we have done ourselves a disservice in the build versus buy debate. The dynamic real-time observability provided by bitdrift Capture seems almost magical and effortless to those who try it. For something that appears to be so “simple” (input workflow definitions into the UI, and within seconds start receiving data specified by those workflows), how hard could it be to build and maintain? Well, it turns out that the answer is very hard, especially at an infrastructure price point that meets budget requirements. In this post, we are going to dig into some of the details about how the bitdrift backend works under the covers, and what it would mean to build and maintain a similar system.
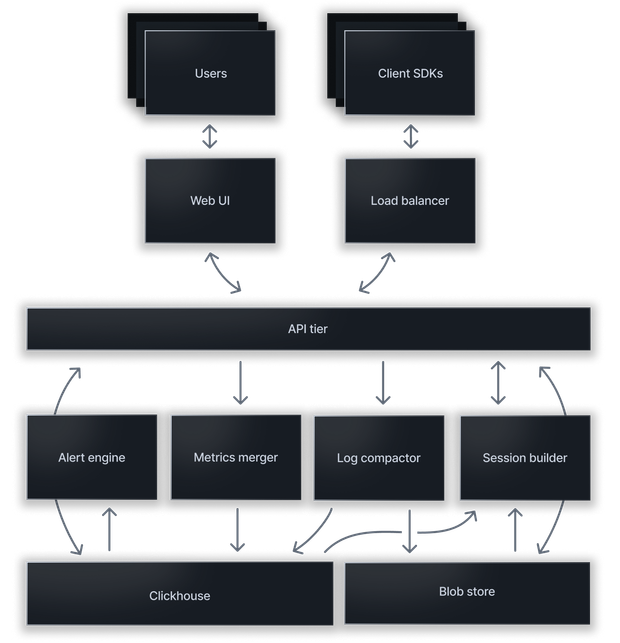 The above diagram shows a high level architecture of the bitdrift Capture system. It is composed of:
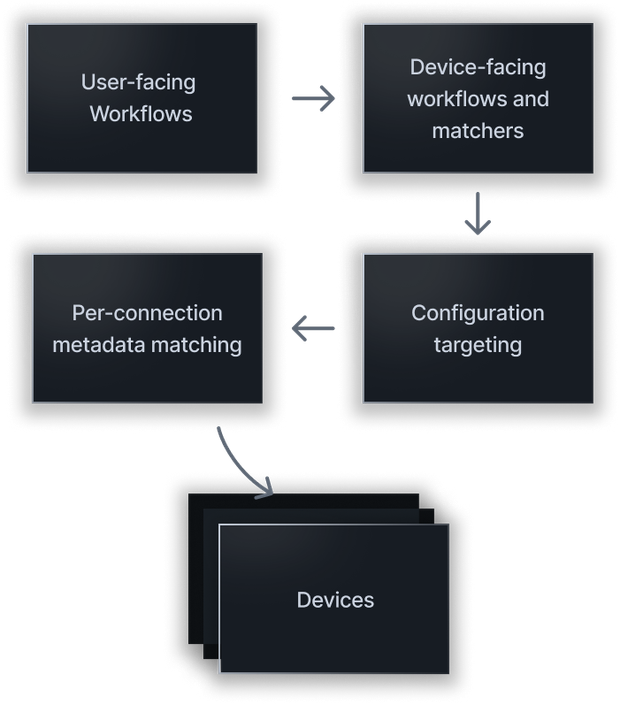 bitdrift allows for exploration/workflow targeting across arbitrary cohorts of devices. For example, all iOS devices, all iOS devices on a particular app version, all Android devices in a particular geographic region, all the way down to individual devices. Additionally, for online clients, we expect configuration updates to be broadcast and enacted within seconds. Doing this at scale is not an easy task. Our configuration pipeline is composed of several different pieces, visualized in the diagram above:
 The timeseries database that backs Capture has some unique requirements compared to most other similar systems:
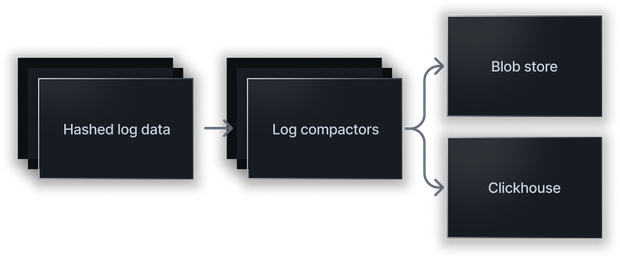 Once session data is being uploaded in response to an upload workflow action state transition and a successful upload intent negotiation (see the data ingestion section above for more information on this), the log data is then sent into the log ingestion pipeline as visualized in the diagram above. The pipeline is composed of the following pieces:
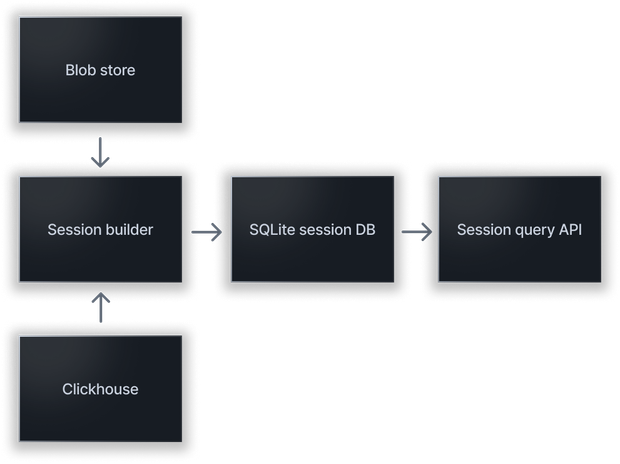 The session builder is responsible for taking log compaction files in cold storage and “hydrating” them into finalized session databases that can be queried against. Doing this quickly is non-trivial. The system is composed of the following parts:
High level system architecture

- A set of smart client SDKs that implement our real-time API, workflow execution system, platform-specific session replay capture, local ring buffer storage, and so on.
- A load balancer tier that accepts bi-directional streaming connections from all client SDKs. Every client maintains an active connection, allowing us to both push new configurations in real-time and then receive information in response such as logs and dynamic metrics.
- An API tier that implements the core of our system, including both real-time client configuration and targeting, primary data ingestion, and servicing visualization and query requests from our web UI.
- The API tier sends ingested logs (via client ring buffer flushes) to a log compaction system via a durable queue. The compactor compresses the data, indexes it by session, and stores it in blob storage.
- The API tier also sends ingested metrics to a metrics merging system via a durable queue. This system is responsible for in-memory merging of related metrics, before writing them to Clickhouse.
- The alerting and notification engine uses ingested metric data to run alert queries and perform notifications if applicable.
- When a session timeline/replay is requested, the session builder is responsible for hydrating the session from cold blob storage using indexing data present in Clickhouse. The hydrated session is then directly queried to service the timeline UI.
- Finally, our (beautiful!) web UI contains our exploration/workflow builder, session timeline viewer, and chart/dashboard viewer.
Client SDKs
Our client SDKs implement the local storage ring buffer, real time communication with the control plane, fleet-wide accurate synthetic histogram and counter generation, the workflow state machine execution engine, and more. The core of each SDK is written in Rust and then wrapped in a thin platform-specific wrapper. This allows us to have a single implementation of very complex functionality that we know works the same across every platform we support. The post is not going to go into a lot of depth on the SDKs as we have already written a general overview, a detailed post on the ring buffer, and all of the code is available on GitHub under a source available license. Suffice to say that the SDK, while an engineering achievement on its own, is just a small portion of the overall system as will soon become clear.Load balancing tier
Capture supports millions of simultaneously connected clients. Our bidirectional real-time streaming connection offers advanced functionality such as real-time targeting, real-time telemetry production, and even live tailing of device logs. The downside of maintaining an always on connection per client is infrastructure costs, primarily related to RAM usage for a large number of connections that are mostly idle. For our load balancer we use Envoy. We have spent significant time optimizing per-connection TCP and HTTP/2 buffer usage within Envoy, as well as in our Rust based API server. The goal here is to drive down the per-connection costs so we can provide all of the real-time benefits at a low price point. The ultimate goal for this tier is to move it to owned hardware in collocation facilities in order to further drive down per-connection costs.API tier
Our API tier is a Rust monolithic application that performs a variety of different high level functionality, ranging from CRUD style APIs in service of our web application, to authentication, client configuration targeting, data ingestion, query and visualization, etc.Configuration targeting

- Users create exploration and workflows in our web UI. This is a visual builder that effectively produces a finite state machine for each workflow. For example, match log A, match log B, then emit metric C.
- User workflows are then converted to a device representation. The device representation is what is executed by the client side SDK when received via a configuration update. During this translation process, a few very important optimizations are performed:
- We collapse duplicate workflows to make sure they are executed only once.
- Further, we compute a consistent hash of each state machine path that results in an action. Following from the previous example, match log A, match log B, then emit metric C would have a consistent hash. This hash is used by the SDK to de-dup common actions when emitting metrics and flushing logs. This means that workflows that ultimately generate the same data will share that data. This is both a performance enhancement but is also great for usability. A new workflow may immediately have data if that data is already being ingested by a different workflow.
- Client workflows are associated with “matchers” which indicate which clients they apply to. For example, platform type, client SDK version requirements, and so on. These matchers are used in further steps to determine which clients get which configurations.
- The next step of the process is to load all of the client workflows and matchers into the configuration targeting engine. This engine uses specialized data structures to enable real-time matching between client connections and applicable configurations.
- When a client is connected, it presents static metadata as part of the handshake. This metadata, which includes things like platform type, app version, SDK version, etc. is then used to select applicable configurations to send (if there are newer applicable configurations) as well as to register for configuration updates that will be applied in real-time in the case of updates. During configuration updates, the updates are broadcast in an efficient manner across all connected clients such that updates can be sent immediately if applicable.
Data ingestion
The API server is responsible for ingesting synthetic metrics, logging data, and user journey (Sankey) paths. The ingestion process takes care of data validation, rate limiting, etc. before enqueueing data onto durable queues for further processing by background tasks as described below. In the case of both logging data as well as user journey paths, the backend coordinates with the client SDK on “upload intents” which allows the client SDK to ask for permission to upload before uploading data. This enables the backend to avoid ingesting large amounts of largely duplicative data. For example, a workflow flush data action might match on a very large number of clients. Instead of having every client upload the contents of the ring buffer leading to hundreds of thousands or millions of sessions that will never be looked at, clients will be naturally throttled, and many will be told not to upload their session data. This dynamic mechanism allows for real-time targeted uploads without the fear of boundless data ingestion that will likely not be utilized.Query and visualization APIs
The bitdrift platform can be used to display session timelines as well as many different types of charts built on top of ingested synthetic metric data (simple line charts, rate charts, tree map charts, etc.). The API server implements our query frontend for Clickhouse, which is where we store the raw merged metric data. While some queries are relatively straightforward, many are not. The most challenging and interesting work we have done in this space is around dynamic TopK determination during query execution. The platform allows for synthetic metrics using a log field as a group by key. For example, imagine a log with a field specifying product type as well as a field specifying product page load latency. Capture allows for creating a synthetic histogram of page load latency grouped by the product type. Given that the cardinality of product type could be hundreds or thousands of items, it isn’t reasonable to display all of these items on the visualized chart. Instead we show the TopK (e.g., the top 5) items. In this case it would be the top 5 largest latencies. Determining which top 5 to show is a challenging exercise around data smoothing. We would like to balance not weighing single outlier points too heavily while still taking spikes into account. Further, once the TopK are selected, they must become “sticky” during subsequent streaming data updates to avoid distracting data update bounces while the portal is open. We will do a dedicated post on this topic in the future as it is an exciting technical topic in its own right.Alerting and notification APIs
The API server implements all of the functionality required for creating alert definitions and session capture notification definitions. These definitions are then used as alerting and notification engine inputs as discussed below.Metrics merger

- It is designed to receive metrics from millions of clients simultaneously, all often writing the same metric ID and timepoint (most Time Series Databases (TSDB) allow only a single value for a discrete metric and time point to be written).
- The nature of mobile means that we would like to be able to backfill data over arbitrary timespans. Devices might contain relevant metrics, go offline and then come back online hours or even days later (most TSDB allow only a very small backfill window before rejecting data).
- Support very large cardinality per time series (tens of thousands or more). Most TSDB have a hard time both ingesting and querying high cardinality data.
- For percentile/histogram data we aim to provide real quantile values across millions of endpoints, within a small error bound. Meaning, we do not want to compute percentile of X (e.g., p95) on each client, and then perform averages across many different clients during backend data ingestion. Instead we want to aggregate histogram data across all clients as it flows into the backing database thus providing a true pX value for a given metric.
- As metric data is ingested by the API tier, it is split and hashed into a bucket composed of the metric ID, ingested fields/tags, and per-minute time bucket. The hash key is used when inserting the data into the durable queue, which makes sure that individual metric values for a specific key are routed to the same merge worker instance.
- The merge workers perform per metric key aggregation in-memory for a period of 1 minute. For counters this is a simple increment. For histograms we take the full incoming sketch and aggregate it with the running in-memory sketch. This process is optimized for potentially millions of clients sending the same set of metrics in a given time period, but also handles the case of a laggard backfill just as well. By using in-memory merging, in most cases we can reduce the load on Clickhouse by 10-20x which is a worthwhile compromise between durability and cost.
- The in-memory merging phase is also used for high level cardinality control. Even though we have designed our Clickhouse tables to reasonably support very high cardinality fields, completely unbounded cardinality would impact query performance and reduce data merging, not to mention that typically it ends up being not useful to the end user and is usually not what they intend from an exploration perspective. During this phase we apply cardinality controls implemented via sliding Cuckoo filters that allow us to block completely unbounded cardinality.
- At the end of the per-minute in-memory aggregation window, the data is then written to Clickhouse. We make heavy use of AggregatingMergeTree tables which allows the database to perform further aggregation and merging across arbitrary time periods. Aggregating counters in Clickhouse is again relatively simple. Histogram data is another story. We still (ab)use Clickhouse for this purpose, but had to undertake significant work to send sketches directly to the database for aggregation (versus individual values). This involved reverse engineering the format Clickhouse uses for internal storage of sketch data as well as modifying our client library to send raw aggregation data to the database for merging. All of this effort has been worth it as it satisfies our goal of allowing accurate aggregation of histogram data all the way from the client.
- We have carefully designed our Clickhouse tables to support reasonable query performance even with per-timeseries cardinality in the tens of thousands. Additionally, we make use of skipping indexes on time series tags which greatly improves the performance of filtered queries.
Alerting and notification engine
The alerting and notification engine is responsible for executing scheduled metric queries. In response to alert query breaches, the system then routes notifications to configured targets, including Slack and PagerDuty. While alerting is simple in theory, in practice there are quite a few gotchas around reliably implementing this part of the system, including:- Idempotent alert query execution (we use a job scheduling system for this purpose).
- Parallelization of alert queries across multiple nodes (we shard queries across different nodes in the scheduled job).
- Making sure notifications are reliably sent when an alert condition is detected (we use a durable queue for processing notification events).
Log compactor

- Similar to incoming metric data, logs are hashed by session ID when inserted into the durable queue. This ensures that all log data for a particular session arrives at the same log compaction worker. The purpose of this is to attempt to colocate related logs in the same compaction block so make session building more efficient as described in the following section.
- The log compactors take log data from the durable queue (hopefully with all data for a session being serviced by a single queue partition) and create compacted cold storage files that may contain data from multiple sessions. These files are compressed using ZSTD, uploaded to blob storage, and then an index entry is written to Clickhouse that associates a session ID along with the location of the file in blob storage. The file key uses a snowflake style ID which has the additional property of implicitly being an efficient 8 byte value and also ordered by time. This avoids an additional “created at” column in the index and makes for very easy range and expiration queries.
Session builder

- The session builder responds to “hydration” requests from our web portal when a user asks to view a captured session (a workflow that terminates in a “capture session” action).
- The session builder first checks if the session has already been hydrated. If so, it can short circuit any further work.
- If the session has not previously been hydrated, the compacted storage blobs that contain data for the requested session are queried from Clickhouse. All of the relevant files are then fetched from blob storage in parallel. Parallelization is important in order to hydrate the requested session as quickly as possible. This ends up being a very tricky dance to avoid OOMing the hydration system as there are many different places in the pipeline that can allocate memory, ranging from downloading compressed files from blob storage, performing streaming ZSTD decompression, to inserting relevant session logs into a newly created SQLite database. We have carefully engineered this part of the system to use a finite amount of RAM for each processed file across network downloads, decompression, etc.. In this way we can set the max files that are processed in parallel and be confident that the system will not OOM. In some cases the hydration process works over thousands of files, if for example the session occurred over many hours or even days.
- As alluded to above, the final hydration form is a SQLite database optimized for relational session queries that drive the timeline UI. Even for very large sessions with hundreds of thousands of logs, the system is able to perform efficient query and display of the data using the local cached databases.