Announcing stability insights
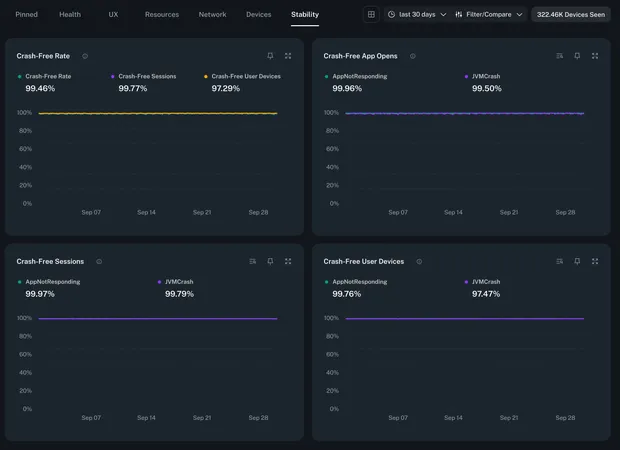
bitdrift Capture just got even more powerful: as of today, we’ve added app stability insights! Built on top of our crash reporting support we now automatically surface app stability scores. This is calculated as the percentage of users who remained crash-free within a given time period and/or app version. You can use this along with our Instant Insights comparison capabilities to monitor the reliability of your releases.

When we launched crash reporting, we knew that a fast follow had to be high level stability scores for apps, broken down by app version. Developers can use these scores to do a quick check on overall stability and health. The scores are included by default within Instant Insights: our one stop shop for the most important high level metrics that every app developer should care about. (Obviously we think that there are a lot of important things to look at other than crash data, but for a holistic view of overall app health this is certainly a critical component).
The charts we are shipping today include:
- Crash-free app opens: The number of crashes divided by the total number of app opens.
- Crash-free sessions: The number of crashing sessions divided by the total number of sessions.
- Crash-free user devices: The number of crashing user devices divided by the total number of user devices.
- Detailed breakdowns: Each of the above charts broken down by crash type (e.g., ANR, JVM crash, etc.).