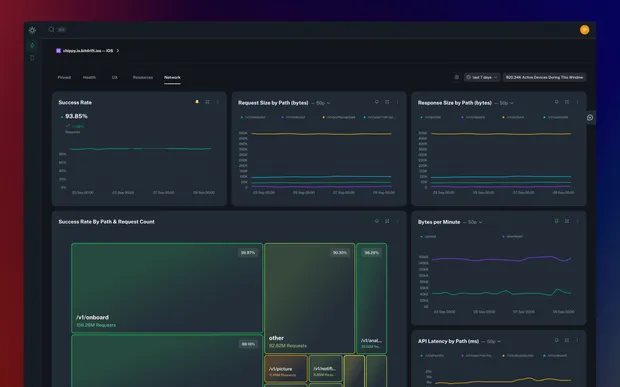
Announcing Instant Insights - a real time view of your customer base
Instant Insights is the new release from bitdrift, and the next step in our journey to redefine mobile observability. Get a real time view of your entire customer base in real time, see what they’re doing, and find their problems before they do. All without any work on your part.

For as long as I can remember, mobile observability has been a high-config, long time to value workflow: instrument, take a few weeks to deploy, collect, and then finally sift through and analyze data. But what if you could get visibility into your fleet instantly?
Today we’re releasing something incredible at bitdrift that flips this script. It’s called Instant Insights – a way to get instant visibility into your entire mobile fleet, no config required. Simply connect our SDK to your application and we automatically generate useful views like network latency and performance issues. It’s only possible because of years of research and bitdrift’s unique control plane model.
Our initial release is focused on reducing the Mean Time to Detection for the most common problems your customers face as they use your applications. Built on top of the bitdrift SDK’s built-in observability, these dashboards allow Engineers and SREs to instantly pinpoint UX performance issues, network latency and application errors, application freezes, runaway resource consumption, and many more. With a real time view of your applications’ health, you’ll be able to compare releases as they roll out, identify problematic deployments in seconds, rather than hours or days, and see where customers are quitting out of your application in frustration.
The dashboard isn’t just a rigid set of tiles. Each view in a dashboard is built on a highly configurable bitdrift Workflow that you can tune to target any type of device by operating system, app version, or other system metrics. You can think of Instant Insights as a quick starting point to get an overall view. Once you’ve identified problematic issues, you can use bitdrift’s powerful session timeline features to root cause issues, all without waiting for an application release.
bitdrift has a different point of view on observability. Instead of sending loads of expensive, incomplete telemetry data to the backend only to sift through it for a few precious insights (usually delayed!), we couple a sophisticated device SDK, local storage, and real-time control via our control plane SaaS to build highly accurate, comprehensive on-device intelligence, at a fraction of the cost of other observability systems. It is the closest view to the actual customer experience, delivered in real time and at scale. With this release, we’ve made it easy to access that within seconds of installing our SDK.
If you like Instant Insights, stay tuned. You can look forward to an increasing set of fleet wide device insights, user experience journeys and performance metrics, and health and resource usage dashboards, all included out of the box. You’ll have the ability to add your own custom product or business metrics, and we'll automatically collect exemplar sessions so you can drill into issues as they happen. With bitdrift, you spend less time on debugging and more time on building delightful mobile applications.
Interested in learning more? Check out the sandbox to get a hands-on feel for what working with Capture is like or get in touch with us for a demo.
Author
Pete Morelli