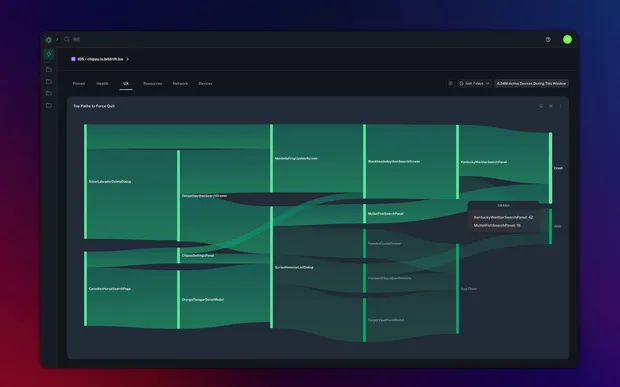
Announcing User Journeys: see the paths users take through your apps
Today we are excited to announce the newest feature in bitdrift Capture: User Journeys. User Journeys allow you to show the frequency of different paths that users have taken in order to arrive at a particular state in your app. This type of analysis is invaluable for better understanding conversion, churn, force quits, rage clicks, and many other behaviors that are critical to optimize for the best customer experience.

At bitdrift, we have a very different take on observability: on-device intelligence. Instead of sending loads of expensive telemetry data only to later sift through it for a few precious insights, we couple a sophisticated device SDK, local storage, and real-time control via our control plane SaaS, in order to dynamically fetch only the data that is needed in order to understand customer behavior and solve problems quickly. We give you 1000x the observability at 0.01x the cost.
What is a user journey analysis? Imagine that you have a shopping app. The most important action in this app is clearly the “buy” button on the checkout screen. We can generate interesting metrics about how often people click on this button (and how much they spend), but what if you want to start understanding the sequence of app events that lead to conversion/purchase? Are some flows more likely to lead to conversion than others? Or imagine that you want even more detailed data around which flows lead to purchases above $500? These types of questions are typically done using user journey analysis (and are typically visualized using Sankey diagrams). The end result of user journey analysis is a set of paths, sorted by frequency, that can be used to understand behavior. While conversion is the common example, the same type of analysis can be used for negative cases as well such as force quits.
You might be thinking “okay, but my existing RUM solution does that.” And while user journey analysis is not a novel feature and can be found in existing RUM solutions, these existing solutions are constrained by the fact that they have to send all data to the backend for analysis. This has two very important implications:
- You have to know what branching and filtering conditions you will use ahead of time. If you get them wrong you will have to wait weeks to rollout changes and deal with inconsistent data between app versions.
- Because the volume of data required to perform the analysis is large, it’s typically impractical to send it all to the backend, so it’s usually aggressively sampled, making it difficult to accurately understand user behavior, especially when it extends to smaller subpopulations.