PricingDocs

Announcing unique device tracking, multiple group by, and table charts

Today we are excited to announce several new charting features within bitdrift Capture: unique device tracking, dynamic grouping by more than one dimension, and a new table view that streamlines high level data analysis. These new charting features make Capture’s industry leading dynamic metrics capabilities even better, giving mobile developers unprecedented visibility into their fleets, so you can build better, more resilient apps faster. Let’s dive in!
Announcing unique device tracking, multiple group by, and table charts

Unique device tracking

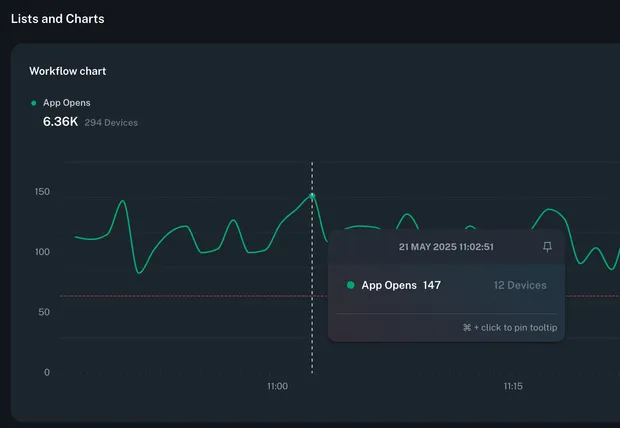
Capture provides the powerful ability to produce synthetic metrics from wide logs. This means that you don’t have to know what metrics you want ahead of time. You simply log everything, and then decide dynamically and in real-time what counter, rate, average, and histogram metrics you want to collect. However, up to now it was impossible to understand how many unique devices were contributing to each metric. Is it one device experiencing 100 errors on a particular screen, or 100 devices experiencing the error one time? Capture now collects unique device counts along with every metric data point and shows this information on all chart views, making it trivial to answer the above question, or any other question like it!

Multiple group by charts

Up to now, Capture only had the ability to group charts by a single dynamic dimension. For example, grouping HTTP 5xx error codes be path, device model, foreground status, etc. but only one of them. Now Capture can group by N dimensions, making it trivial to group by device model and foreground status, for example. This enables investigation slicing and dicing that was not previously possible, and is especially important given that sometimes problems are unique to several dimensions and not just one.

Table charts

While time series visualizations are fantastic for understanding trends over time, sometimes it’s preferable to just have a single “answer” that is easy to digest, track, create SLOs around, etc. The new table view presents summary information for a time series in an easy to digest format. Users can easily toggle between the time series view and the table view to get the data that they want at any point in time.

Come and get it

Capture is changing the mobile observability game by adding a control plane and local storage on every mobile device, providing extremely detailed telemetry when you need it, and none when you don’t. If lack of unique device tracking, multiple group by, or table chart views was keeping you away, now is the time to give us a try! Interested in learning more? Check out the sandbox to get a hands-on feel for what working with Capture is like and then get in touch with us for a demo. Please join us in Slack as well to ask questions and give feedback!

Stay in the know, sign up to the bitdrift newsletter.

Author