Announcing feature flag support
Your mobile experimentation platform knows which variant the user saw. Now Capture does too. Today we're launching feature flag support, giving you automatic visibility into which feature flags were exposed when issues occurred. Filter crashes by variant, see feature flag breakdowns in issue reports, and build workflows that react to specific experimental conditions—all without leaving Capture.

The Experiment Debugging Gap
Here’s a scenario every mobile developer knows: crash rates spike after a release. You open the issue in Capture—stack trace, session replay, the full timeline of events. But you’re also running three A/B tests. Was one of them the culprit? That’s often the first question when a new issue appears. New crashes frequently come from new code paths, and experiments introduce plenty of them. By adding feature flags to the crash reporter, you can immediately see whether an issue is isolated to users with a specific flag enabled—cutting straight to the root cause. Every modern app runs experiments, and every app has crashes. Your observability tool should understand that relationship natively. Now it does.What We’re Shipping
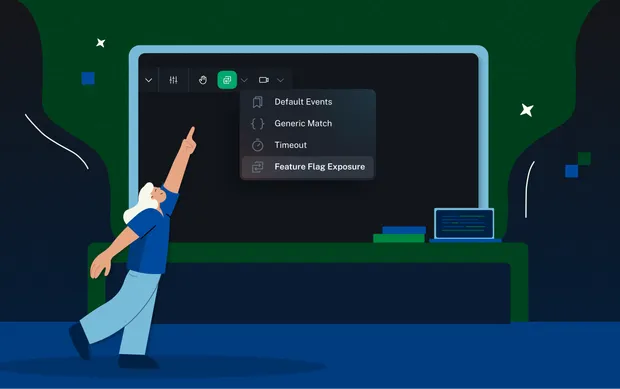
Starting today, Capture has first-class support for feature flags:- Record feature flag exposures: A single SDK call signals which variants a user has seen, captured at the moment of exposure rather than assignment.
- See feature flags in issue reports: Every issue report includes the feature flags that were exposed when the issue occurred, giving you immediate context.
- Filter and group by feature flags: Filter your issue list by specific feature flags or variants, and see breakdowns of how issues correlate to feature flags.
- Build workflows around feature flags: Create workflows that match on specific feature flag states or trigger when a user is exposed to a particular variant.
- Group by feature flag variant: Use the feature flag variant as the group by dimension in any chart.
The SDK Integration
Recording exposures is straightforward. When a user actually sees a feature—not just gets assigned to a variant—call the SDK:swift
Logger.setFeatureFlagExposure(withName: "checkout-redesign", variant: "variant-b")
The key distinction here is exposure vs assignment. A user might be assigned to a variant when the app launches, but they're only exposed when they actually see the affected feature. Recording at the point of exposure ensures your data accurately reflects what the user experienced. For more details on the SDK integration, see our feature flags documentation.kotlin
Logger.setFeatureFlagExposure("checkout-redesign", "variant-b")
Feature flags in issues
Once you're recording feature flag exposures, they automatically appear in your issue reports. When investigating a crash or error, you can immediately see:- Which feature flags were exposed at the time of the issue
- The specific variant the user was exposed to
- A breakdown of how the issue distributes across different variants
Feature flags in workflows
Capture's workflow system lets you build dynamic queries against your mobile fleet. With feature flag support, workflows become even more expressive:- Match on current feature flag state: Create match conditions that check what variants a user is currently exposed to. For example: "If the user is in variant B of the checkout experiment and experiences a network timeout, capture a full session dump."
- Trigger on exposure events: Use the feature flag exposure itself as a trigger in your workflow. For example: "When a user is exposed to the new onboarding flow, start recording session replay."
A better way to debug experiments
Experiments are essential to modern mobile development, but the tooling around them has created a visibility gap. When something goes wrong, understanding the relationship between feature flags and issues is critical—yet most tools leave you piecing things together manually. With bitdrift Capture's feature flag support, that changes. You get automatic correlation between feature flags and issues, the ability to filter and analyze by variant, and workflow capabilities that let you build experiment-aware telemetry. Capture brings a control plane and local storage to every mobile device, providing detailed telemetry when you need it and none when you don't. If missing feature flag visibility has been a gap in your debugging workflow, now is a great time to give Capture a try. Interested in learning more? Check out the sandbox or start a free trial to see what working with Capture is like. You can also get in touch for a demo or join us in Slack to ask questions and share feedback.Author
Snow Pettersen